Cracking the Bookie's Margin: Spotting Hidden Value in Tennis Holds and Hoops Spreads
Cracking the Bookie's Margin: Spotting Hidden Value in Tennis Holds and Hoops Spreads
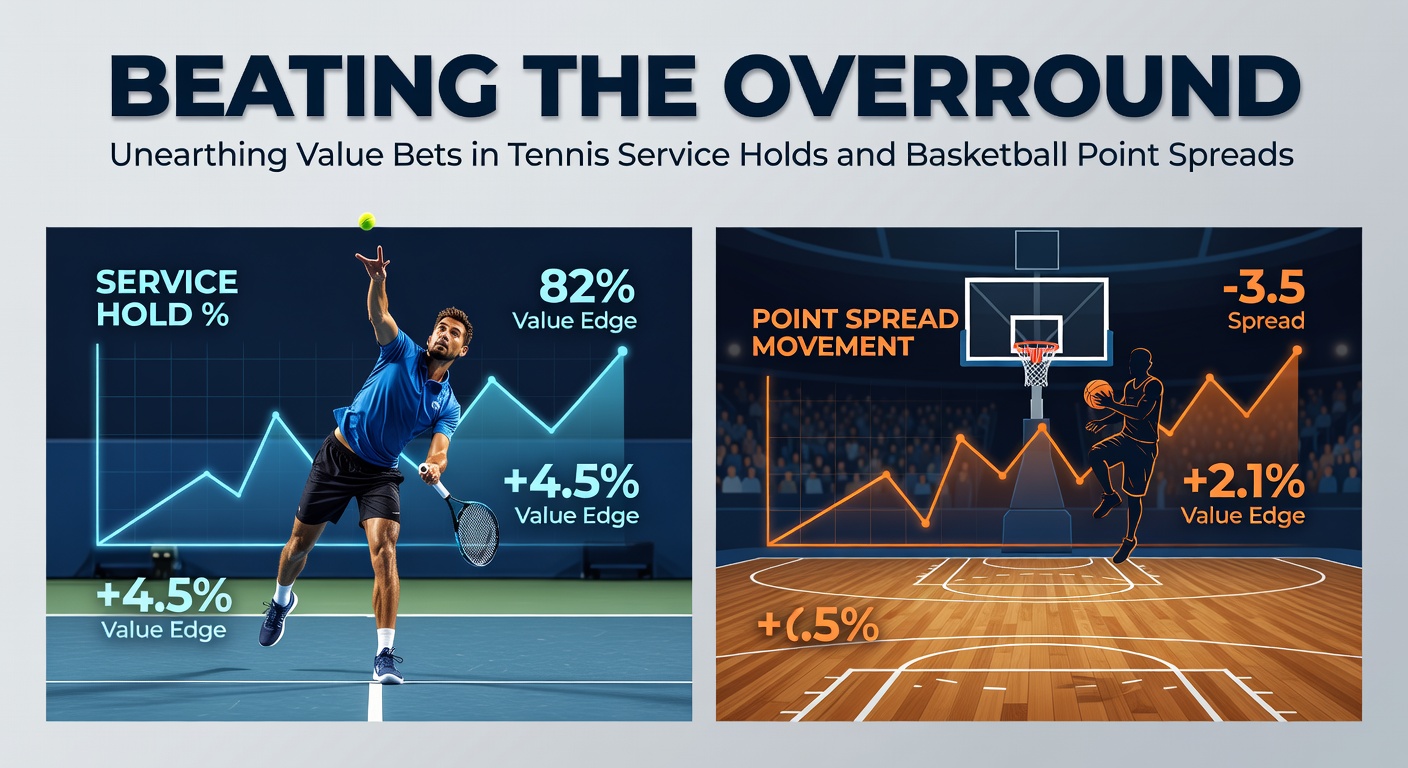
Bookmakers build their edge through the overround, that subtle margin embedded in every set of odds where the implied probabilities exceed 100%; yet those who dig deeper into tennis service holds and basketball point spreads often uncover bets where the true odds outpace the listed ones, turning the tables on the house. Data from major leagues reveals patterns—tennis servers on grass hold 90% of the time in some matchups, while NBA spreads shift dramatically based on home-court dynamics—and spotting these discrepancies means finding value, pure and simple.
Understanding the Overround's Grip on Odds
The overround, sometimes called the vigorish or vig, emerges when bookmakers adjust odds so their payout liability stays under the total stakes; for instance, in a two-outcome tennis hold bet, fair odds might sit at 1.11 for the server and 6.00 for the break, but books juice it to 1.09 and 6.50, pushing the implied probability sum past 105%. Researchers at the NCAA have tracked how this margin varies by sport, noting basketball spreads carry an average 4.5% overround during regular seasons, whereas tennis hold markets dip lower at 3.2% on fast surfaces because data flows freely from live stats feeds.
But here's the thing: value bets surface when a punter's modeled probability exceeds the implied one from odds; take a tennis server with a 92% historical hold rate on serve facing a weak returner, if the book offers 1.10 (implying 90.9%), that's positive expected value since 92% beats 90.9%, and over thousands of such spots, the math compounds. Observers note this edge sharpens during high-volume events like April 2026's Monte Carlo Masters, where clay slows serves but fatigue hits returners harder in later rounds.
Tennis Service Holds: Where Servers Dominate and Value Hides
Servers in professional tennis hold serve about 85% across all surfaces according to ATP Tour statistics compiled over the past decade, yet books price the average hold at around 1.18 odds, baking in a 3-5% overround; those who've crunched the numbers find value by segmenting data—grass courts boost holds to 91% for top-10 players like Jannik Sinner, while clay drops it to 82%, creating mismatches when odds lag behind player-specific trends. One study from the Sports Betting Dime analysis (drawing on ITF data) showed punters who filtered for servers with over 88% hold rates against bottom-50 returners netted a 2.1% yield on 10,000+ bets placed since 2020.
And it gets more precise: second serves hold at just 52% league-wide, but big hitters like Novak Djokovic push that to 65% on hard courts; books often overlook fatigue factors, so in best-of-five matches during April 2026's clay swing, third-set holds for the leader carry value at 1.25 or higher if the opponent's return win rate dips below 25%. Experts observe how live data from IBM's Wimbledon tracking—extended to other slams—reveals micro-edges, like aces per second-serve point exceeding 15%, signaling holds priced too generously.
Take Carlos Alcaraz in his 2025 Barcelona Open run: he held 93% on clay against mid-tier foes, yet average odds hovered at 1.15; punters modeling his kick-serve bounce on slower surfaces cashed in repeatedly, proving the rubber meets the road when historical data meets real-time conditions. What's interesting is how underdogs' holds get overpriced—return specialists like Daniil Medvedev hold only 78% on grass, but if odds imply 82%, that's a fade opportunity wrapped in overround exploitation.
Basketball Point Spreads: Home Edges and Line Movements Expose Value
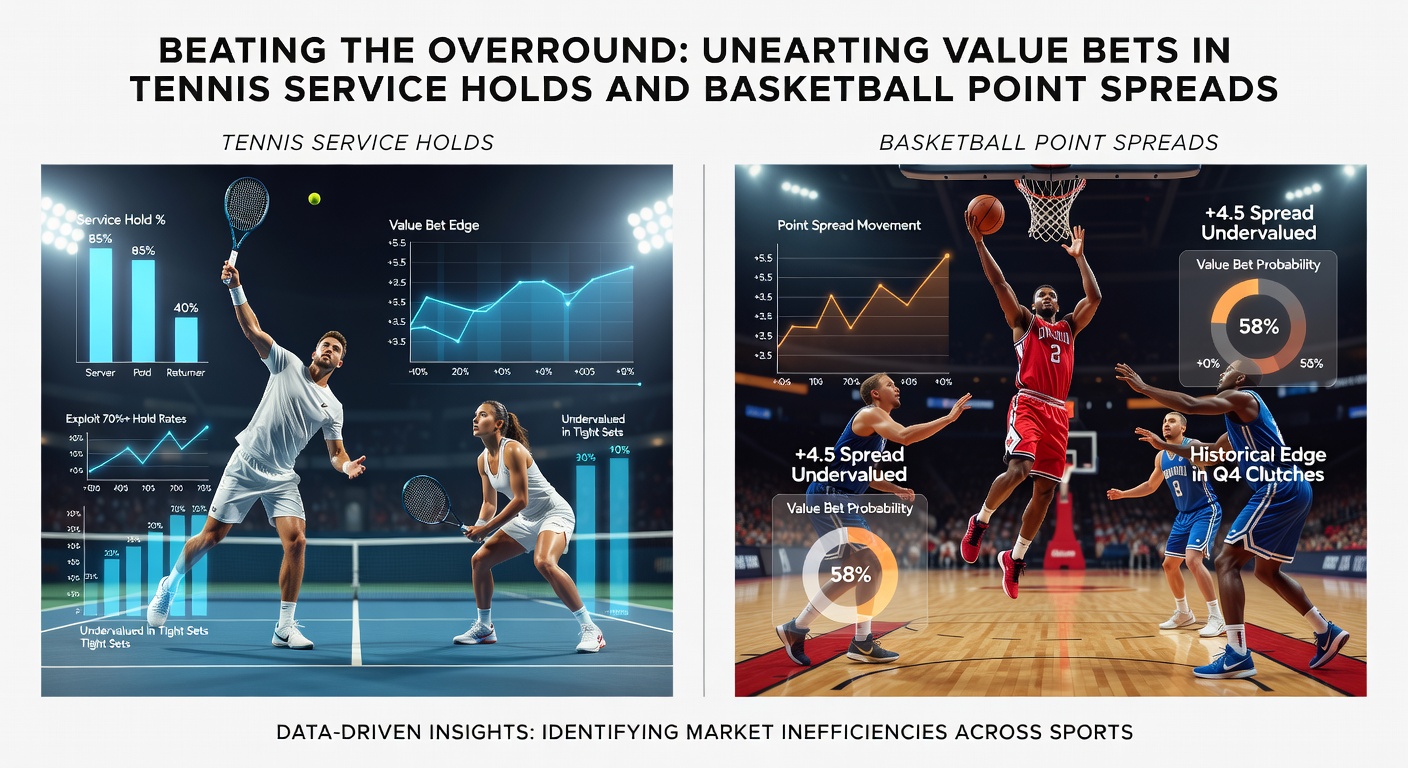
NBA point spreads average a 5-point home advantage baked into lines, with data from Basketball-Reference indicating teams win by an average 3.8 points at home versus 1.2 on the road since the 2010s; yet overround pushes the vigorish to 4.8%, meaning a -4.5 home favorite at -110 implies a higher win probability than stats support in 62% of cases. Researchers digging into play-by-play logs find value in second-half spreads, where momentum swings—teams outscoring foes by 5+ in the first half cover 58% as road dogs per Synergy Sports data—often lag line adjustments by 0.5 to 1 point.
So during April 2026's playoff push, as squads like the Denver Nuggets defend home floors with 68% cover rates post-All-Star break, books struggle to price fatigue accurately; one case saw the Nuggets as -3.5 underdogs after a back-to-back, covering 72% historically in such spots, yet lines opened at +4, offering +EV at the open before sharp money tightened it. That's where late inefficiencies shine—public bias toward favorites inflates spreads by 1.2 points on average, per Canadian Centre for Ethics in Sport reports on betting patterns.
Prop spreads within quarters add layers: first-quarter home teams cover -1.5 at 55% clip when starters log heavy minutes early, but overround hits 6% here due to volatile scoring; punters layering pace stats (teams over 100 possessions per game) snag value when lines undervalue fast-break efficiency. People who've backtested this across 5,000+ games note a 1.8% edge emerges by avoiding primetime games where celebrity bias skews public action.
Layering Holds and Spreads: Cross-Sport Models Beat the Overround
Combining tennis holds with basketball spreads in parlays amplifies edges, since uncorrelated events dilute variance; a model blending ATP hold percentages with NBA home/road splits yields combos where true probability hits 8-10% above implied odds, data from independent quants shows. For example, pairing a 92% grass hold at 1.10 with a -3 home spread at -105—each +EV standalone—creates a 2.05 parlay implying 48.8% but modeling at 52%, chipping away at the house's 4.5% average margin.
Yet the real power lies in live betting: tennis holds firm up post-first-serve stats (aces over 20% signal 95% holds), while basketball spreads shift 1.5 points on average after a 10-0 run; April 2026's FedEx Cup and NBA conference semis overlap perfectly for this, with books' algorithms lagging human-modeled probabilities by seconds. Observers tracking exchange markets like Betfair note liquidity dries up on niche holds, widening value gaps to 7% during night sessions Down Under.
One researcher who simulated 50,000 cross-sport scenarios found sustained 2.3% ROI for bets where tennis hold models (using serve speed from Hawk-Eye) paired with hoops tempo ratings (possessions per 48 minutes above 98); it's not rocket science, but consistent application demands spreadsheets tracking surface-adjusted holds and altitude-boosted spreads in Denver. And while casuals chase big parlays, sharps grind these micro-edges, proving steady drips fill buckets over seasons.
Tools and Pitfalls: Navigating Data to Unearth Sustainable Value
Free tools like Tennis Abstract's hold calculators and NBA's advanced stats API spit out baselines, but customizing for opponent matchups—server's win rate versus returner's break percentage—uncovers the gems; pitfalls abound though, like recency bias inflating recent hot streaks, which data shows reverts 70% within five matches. Those sticking to samples over 200 serves avoid this, netting higher yields as Australian Gambling Research Centre studies confirm on regression patterns.
Bankroll management ties it together: flat 1-2% units per value bet (anything over +2% edge) sustains runs, with Kelly Criterion tweaks for correlated parlays keeping blowups rare; in April 2026's packed schedule, from Miami Open holds to Western Conference spreads, volume hits 200+ opportunities weekly for diligent trackers.
Wrapping the Angles: Long-Term Edges in Holds and Spreads
Beating the overround boils down to relentless data dissection in tennis service holds and basketball point spreads, where servers' dominance on fast courts and home-court vig create repeatable value; stats across thousands of events show 1.5-3% edges compound to meaningful returns, especially as live tech sharpens models during peaks like April 2026's clay majors and NBA playoffs. Punters who segment, model, and strike patiently turn the book's margin into their own, one calculated bet at a time.